
A few interesting charts –
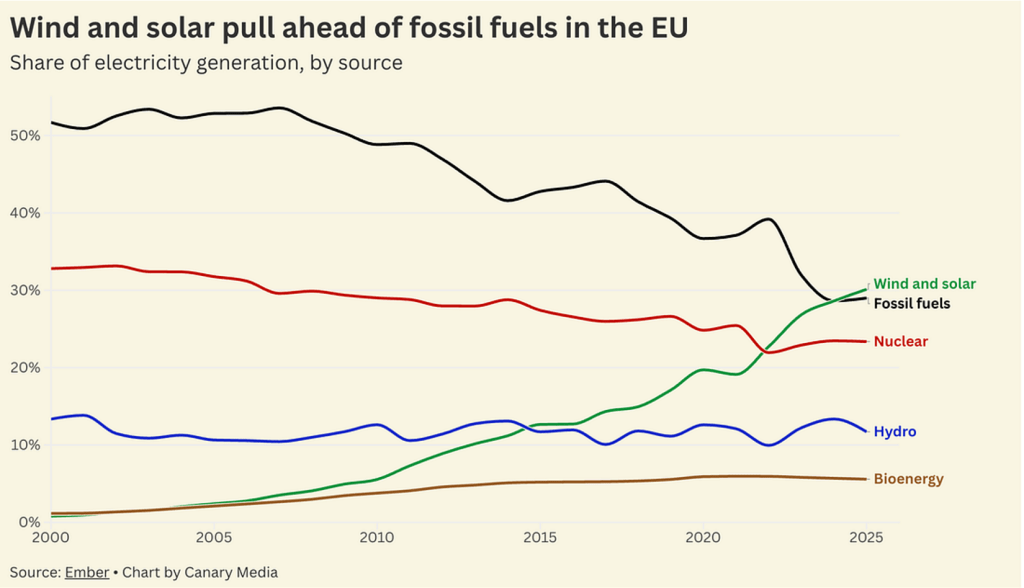
The EU generated more energy from wind and solar in 2025 than fossil fuels for the first time.
For all the political noise around renewables in the US, the US Energy Information Administration forecasts 99% of new energy to come from renewables.
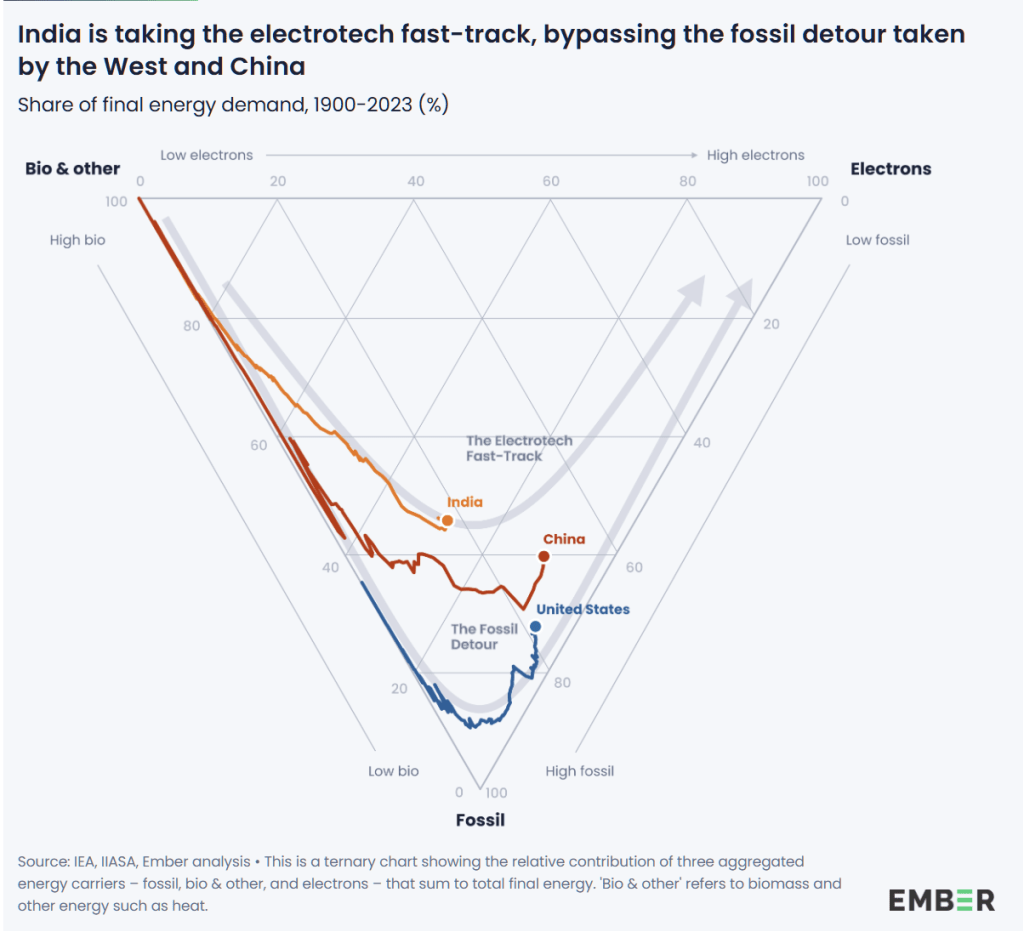
A few years ago, the question that followed such stats was – that’s all well and good in developed economies. What about those that are rapidly developing? That’s where this story gets complicated given the cost of development often involves burning fossil fuels.
This excellent chart lays it out beautifully. India is on a fast track in switching away from fossil fuels. China’s switching pace has continued to accelerate.
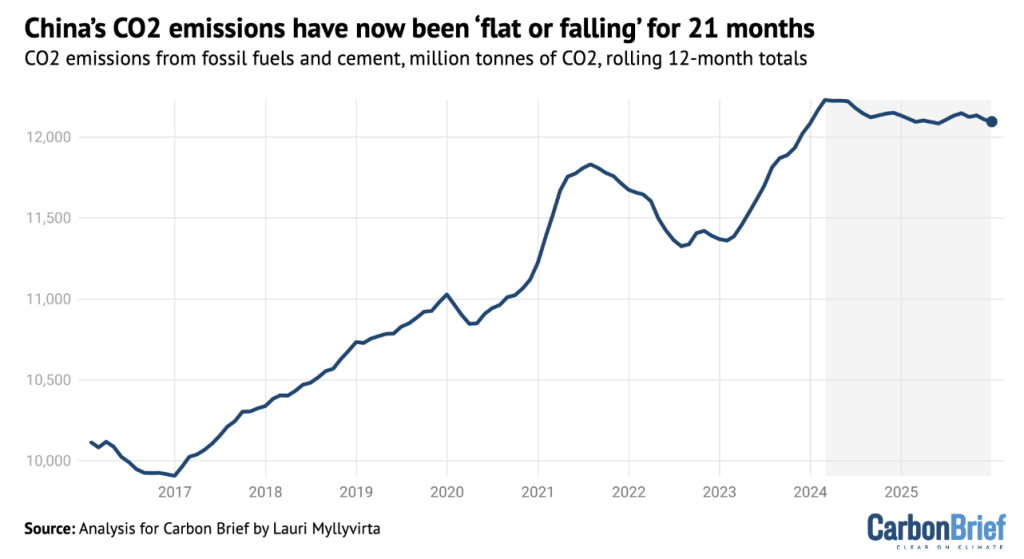
This shows up in China’s CO2 emissions – which declined a bit in 2025.
To be clear, these decisions aren’t being made because all the parties here believe it is the right thing to do.
They are being made because they are economic no-brainers.
When in doubt, follow the money.
